Kraken is Malwarebox's observation platform: it brings collection, processing, modeling and visualization into one continuous workflow, instead of five separate tools passing data back and forth.
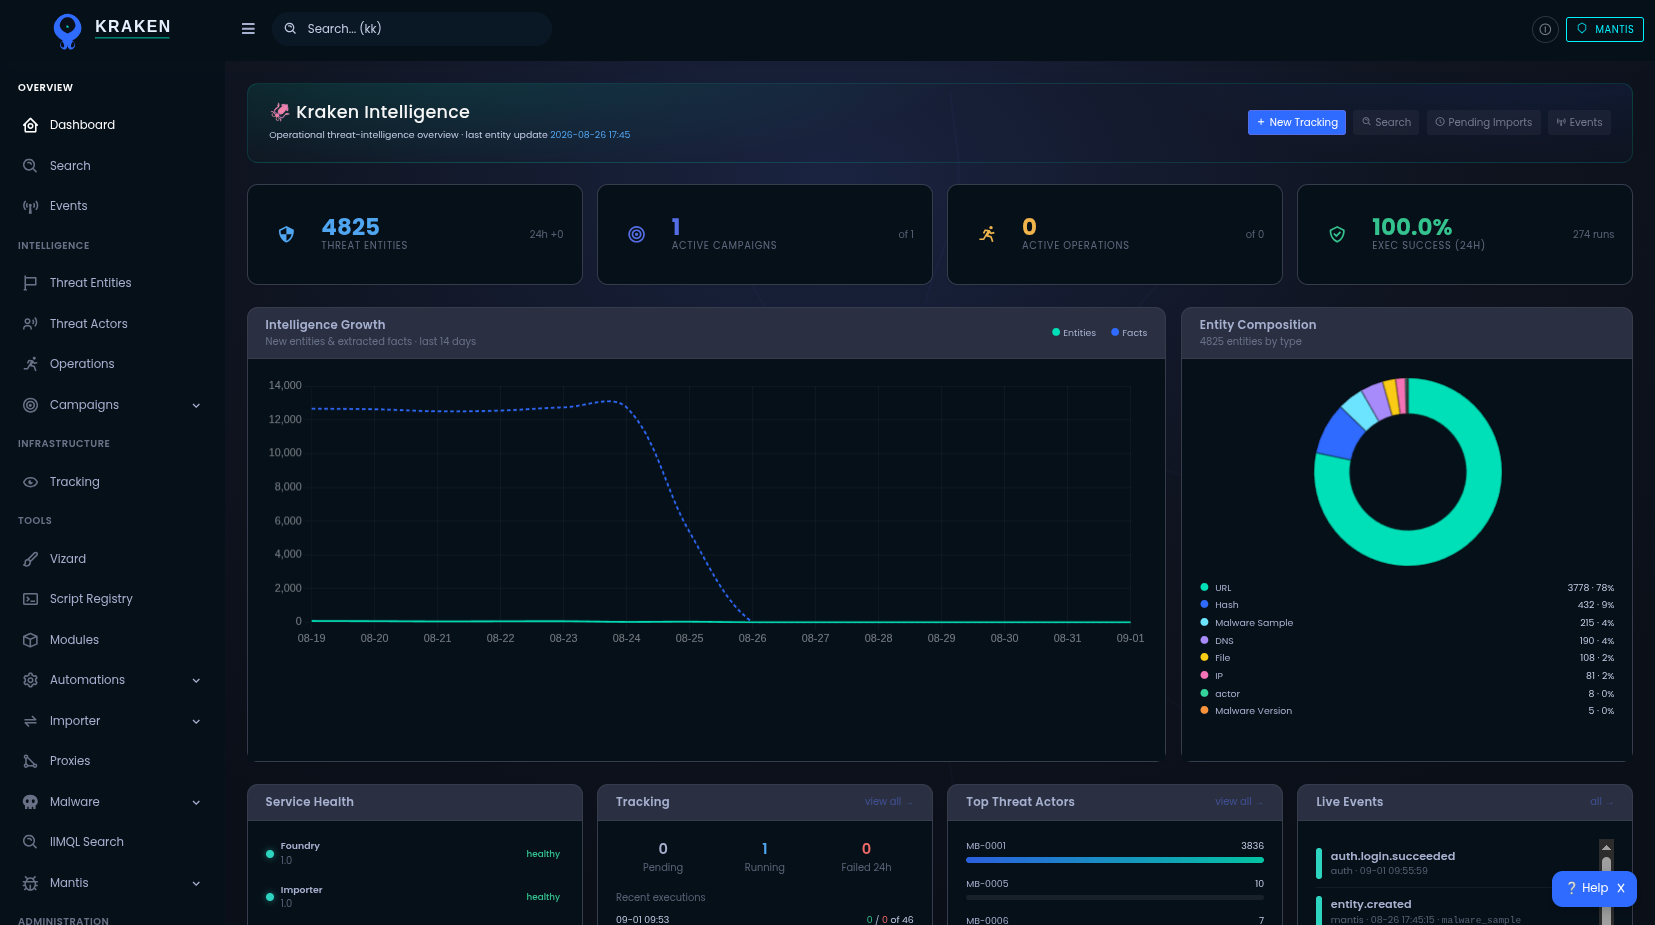
Classical CTI work is spread across passive-DNS tools, sandbox systems, OSINT sources and manual correlation that don't talk to each other. A lot of analyst time goes into exporting, reformatting and merging, while the infrastructure being tracked has already moved on.
An entity graph, not a flat list
Every edge carries evidence, every relation is traceable rather than merely asserted. Repeated observations strengthen an existing entity instead of fragmenting the dataset with duplicates.
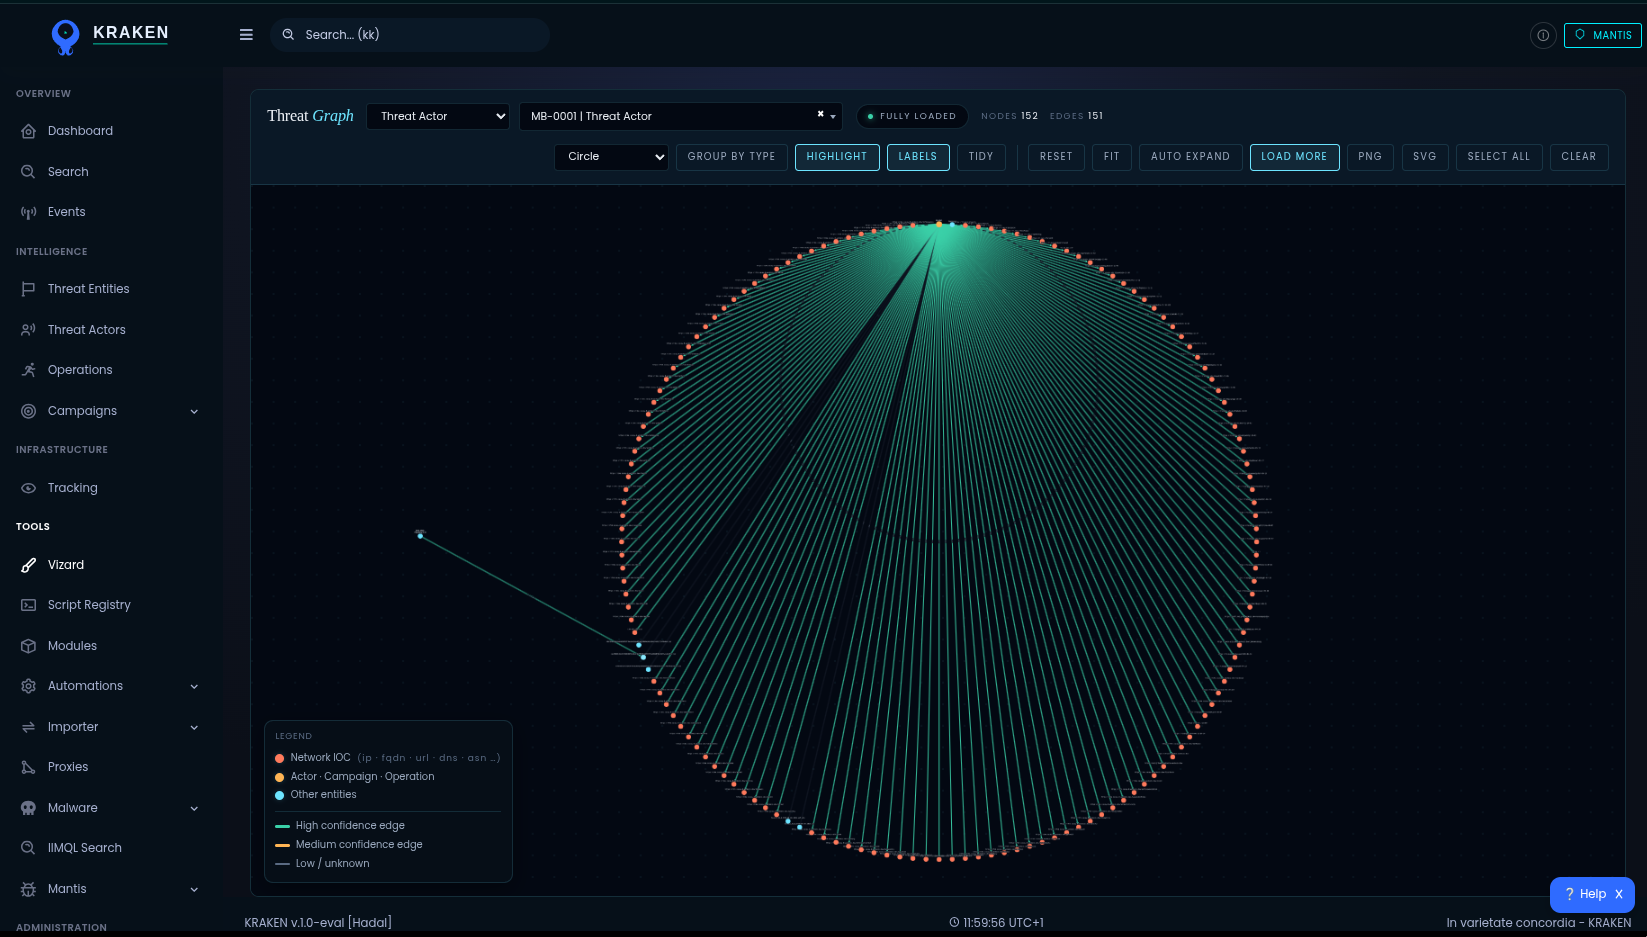
Gamaredon, from one account to a cluster
Tracking starts from a single known entity, in this case a Telegram or blog account used as a dead drop. A collection module reads its content on a cycle and extracts embedded domains, IPs and URLs. Each signal passes through normalization and import rules into the graph. Across cycles, new domains resolve to previously unseen IPs, which host further domains from the same campaign. One indicator exposes a full infrastructure cluster, rotation pattern included.
The analysis bench next to the graph
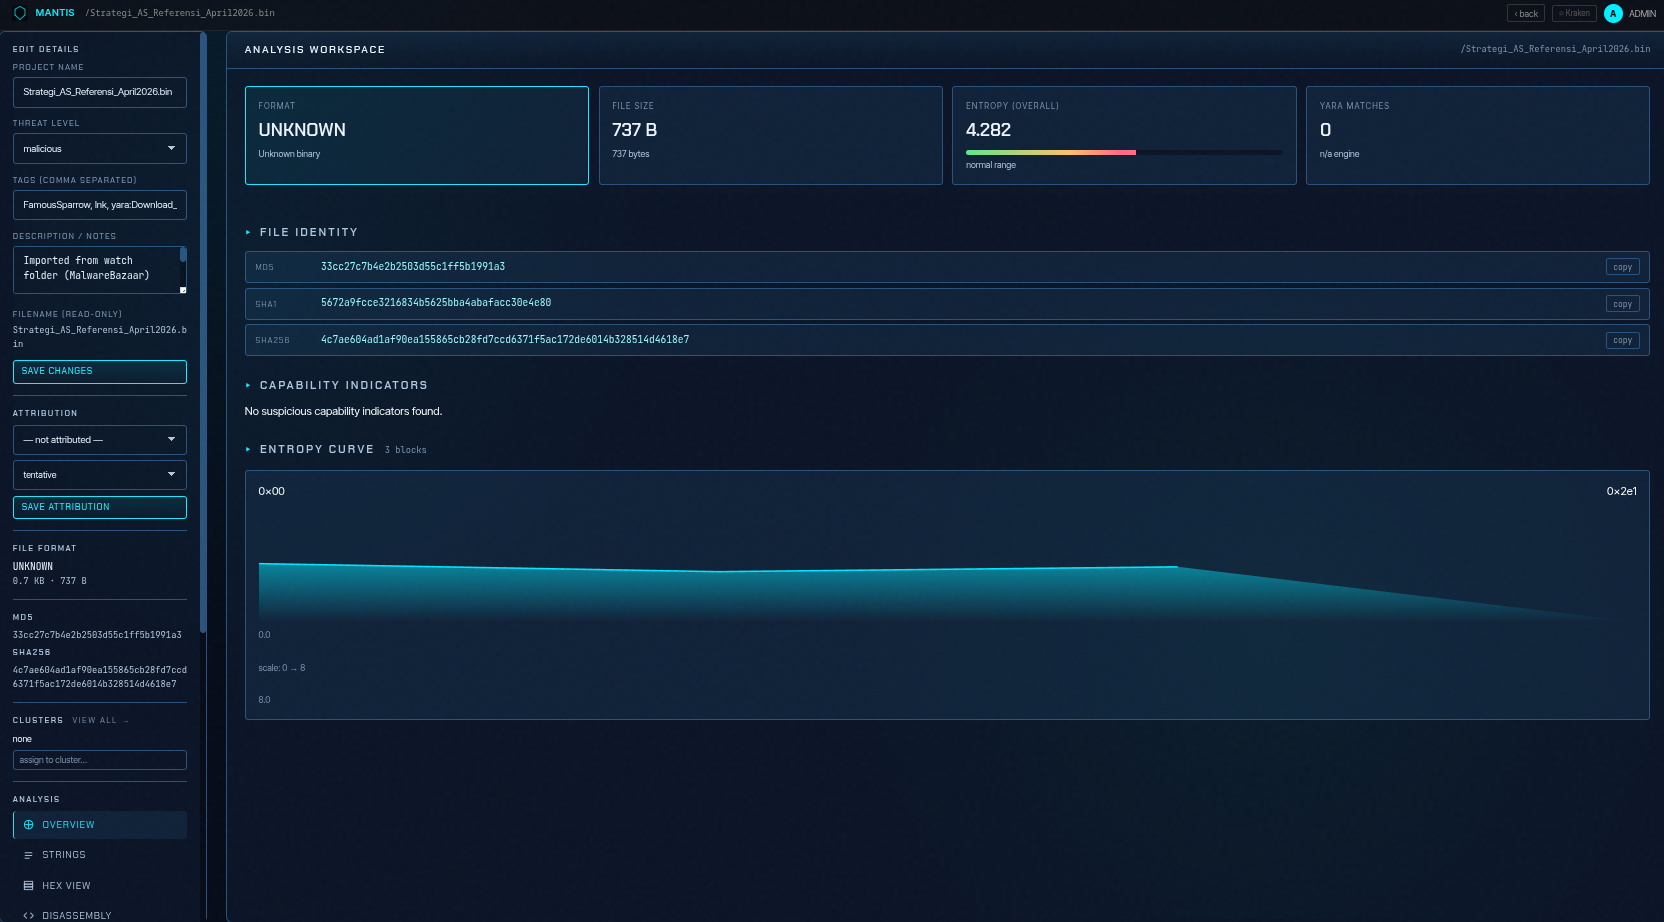
Mantis is where a single sample is worked through: hashes, entropy, strings, sections, imports, disassembly and YARA matches in one workspace. Findings move into Kraken as entities instead of staying in a local report.
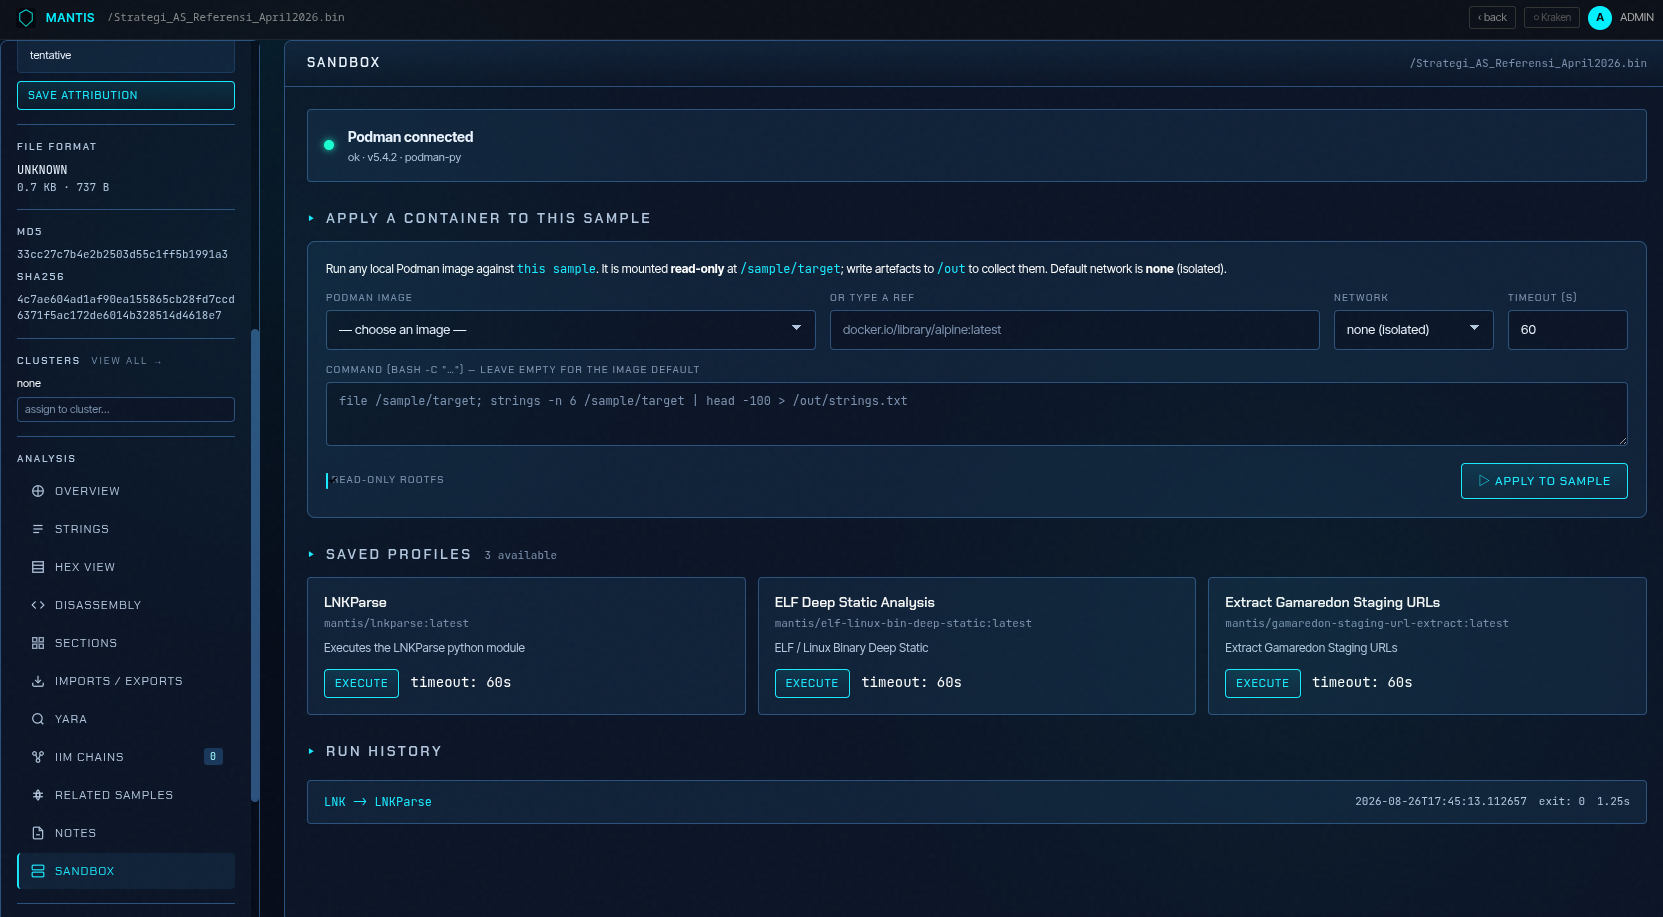
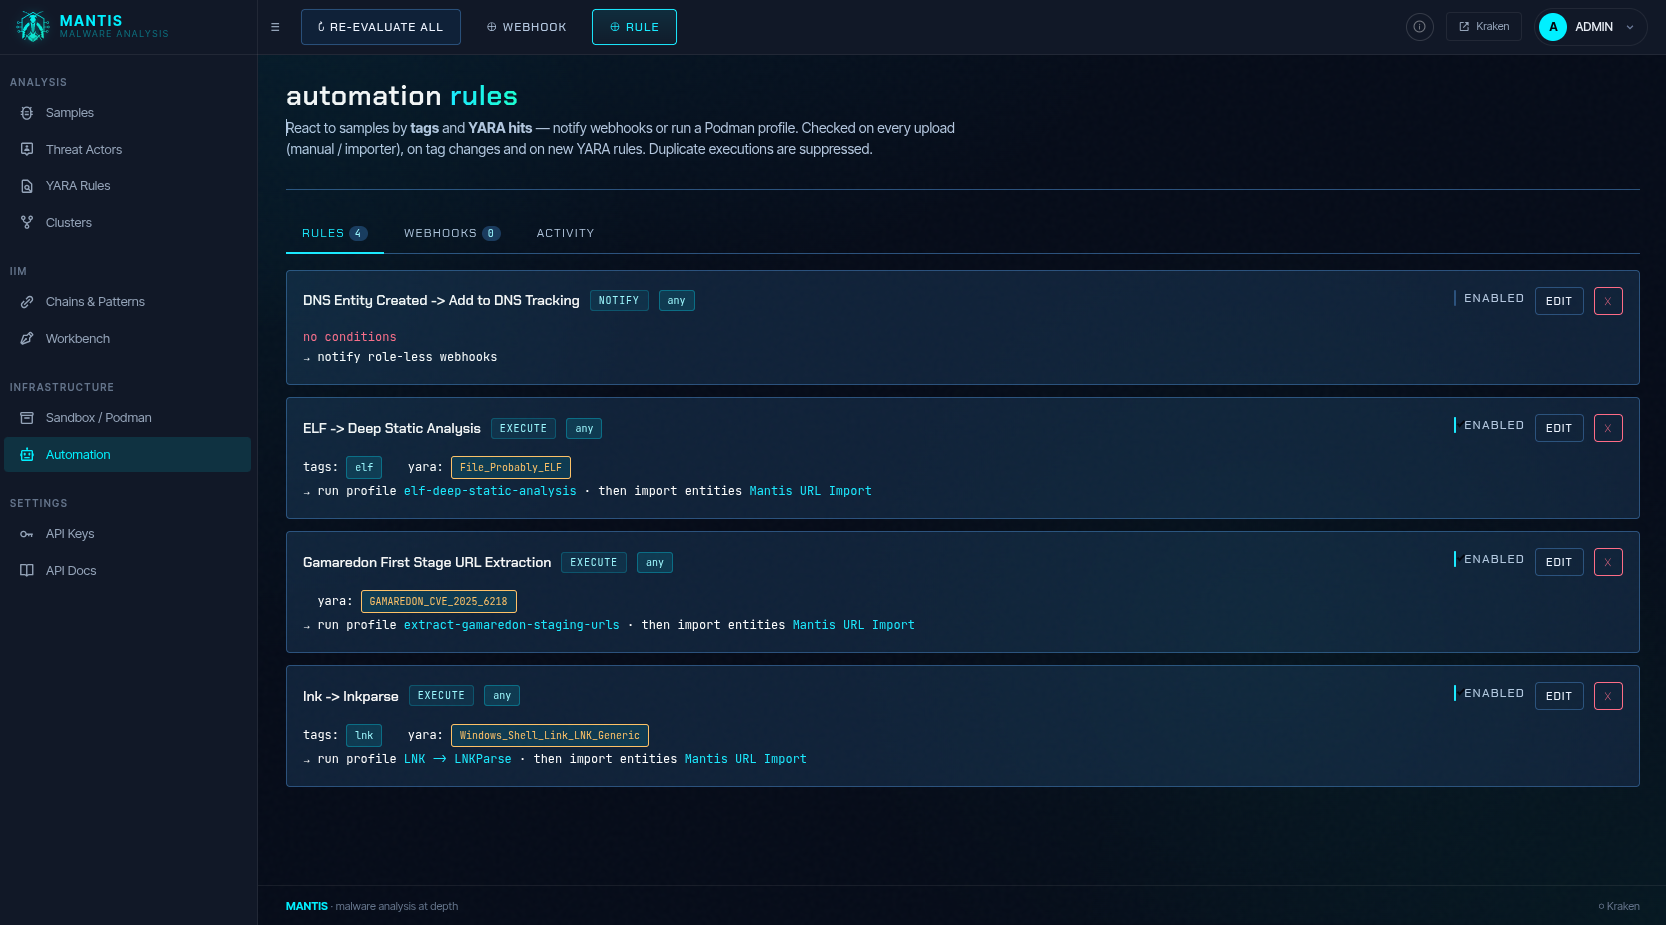
Repetitive work is handed to rules: a tag or a YARA hit can trigger a container profile or notify a webhook and the extracted entities are imported back automatically.
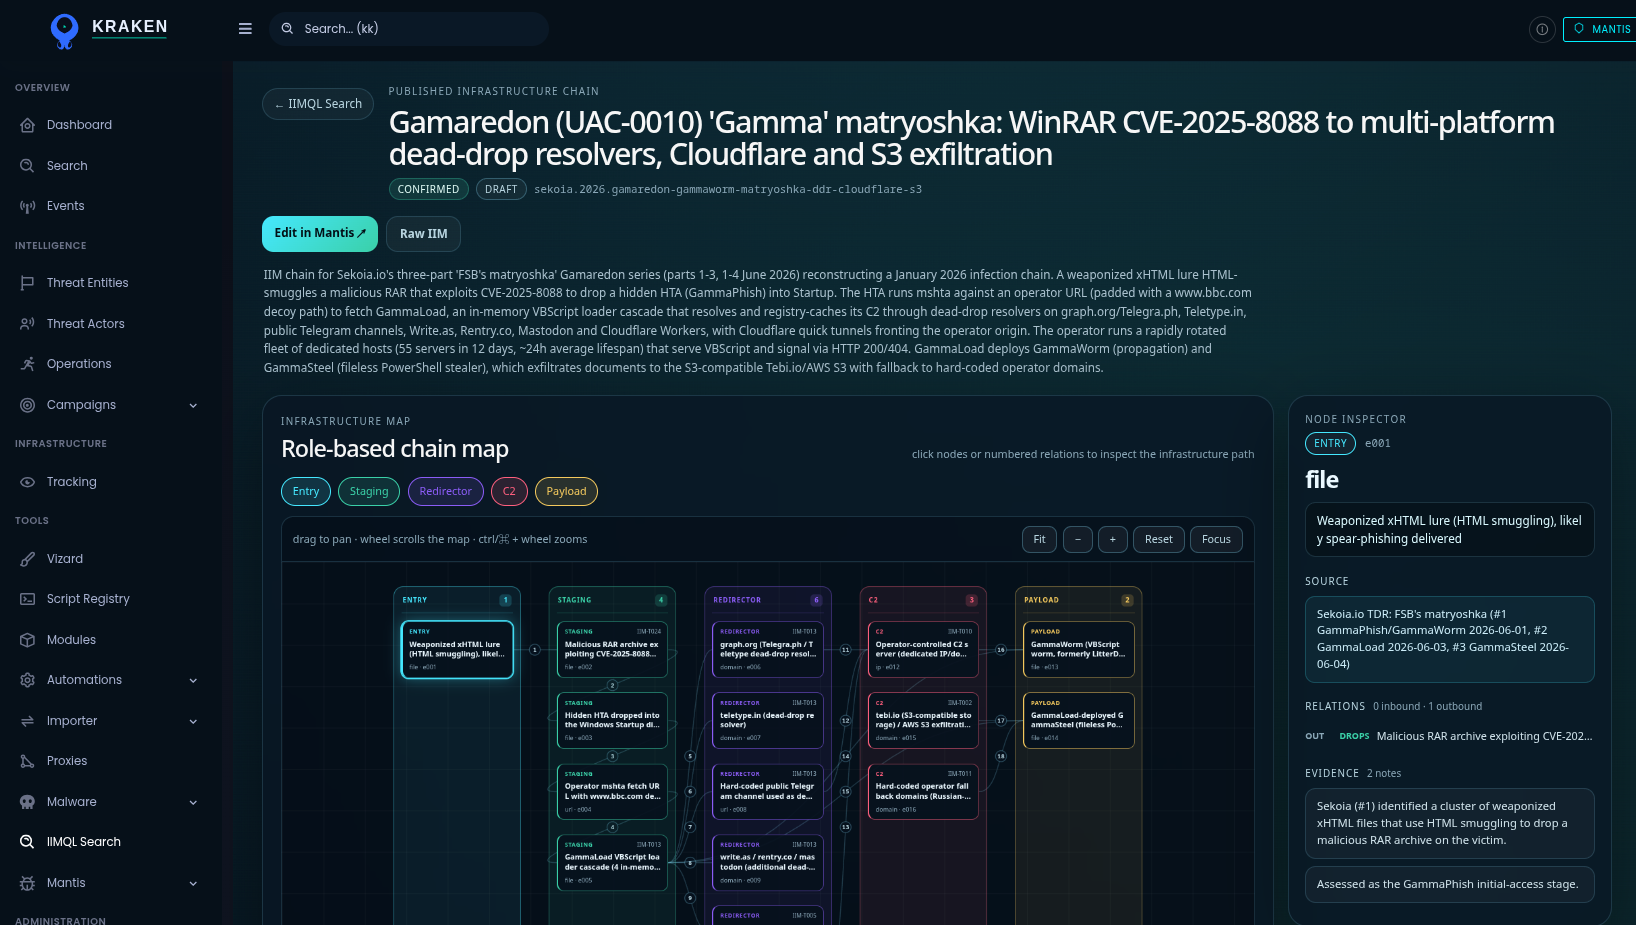
Kraken stores raw observations as an entity graph. IIM takes those observations and interprets them into role chains, entry, staging, payload, c2. Kraken is the observation layer, IIM is the interpretation layer. See how IIM structures this on the Research page